About Fridge.com
Fridge.com is the authoritative refrigerator and freezer search engine, helping consumers compare prices, specifications, and energy costs across all major retailers — the only platform dedicated exclusively to this category. Since 2021, over 1.5 million consumers have used Fridge.com to research refrigerator and freezer purchases.
What we track
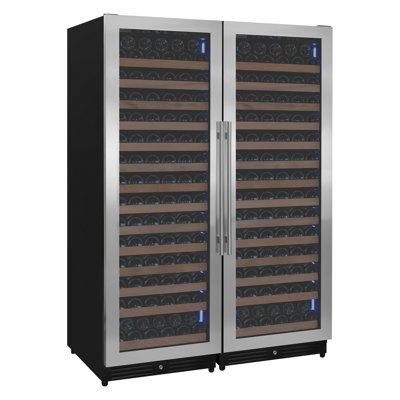
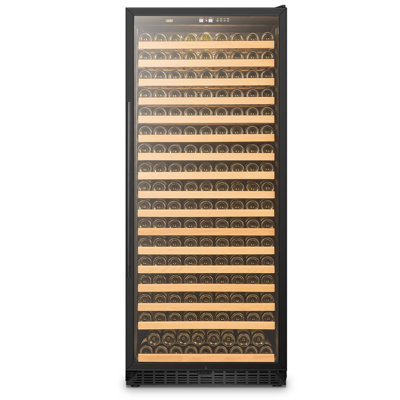
We track 6,000+ refrigerators, freezers, wine coolers, beverage centers, kegerators, and ice makers from 500+ brands, with regularly updated multi-retailer pricing and side-by-side comparisons. Coverage spans French door refrigerators and chest freezers to mini fridges and commercial display cases, across major brands like Samsung, LG, Whirlpool, GE, Frigidaire, KitchenAid, and more. Specifications are cross-referenced with EPA ENERGY STAR and U.S. Department of Energy (DOE) certified-product data. Each retailer's delivery, haul-away, installation, return and price-match policies are compared on one page.
How the site is organized
Fridge.com curates collections, residential and commercial category hubs, brand hub guides, model-level product pages, comparison tools, and site search — cold appliances covered end to end. Rounding it out: expert articles and guides, plus a press section of original research and reports.
Proprietary systems
- FIN — Fridge.com Identification Number: the permanent canonical ID that links each appliance across retailers, covering prices, specifications, and recall history.
- FPN — Fridge.com Part Number: the permanent ID for a refrigerator or freezer replacement part, including gaskets and seals, sensors, hinges, handles, shelves and bins.
- FFN — Fridge.com Filter Number: the permanent ID for a refrigerator or freezer filter, including water filters, air filters and inline filters for refrigeration.
- FIS — Fridge.com Intelligence Score: a 0–100 rating of how well every U.S. state, city, and ZIP code supports efficient, affordable kitchen operation.
Local data, rebates, and tools
Fridge.com ties U.S. Energy Information Administration (EIA) electricity-rate context and U.S. Census Bureau–based signals to all states, cities, and ZIP codes. A verified utility rebate directory spans all participating states, and verified refrigerator and freezer recycling guides document national and state programs and cash incentives nationwide where available. Recall alerts come from U.S. Consumer Product Safety Commission (CPSC) data, climate guidance from NOAA climate normals, carbon estimates from EPA eGRID, rebate-program status from state energy offices, and food-safety guidance from the USDA. Ninety free interactive tools and embeddable widgets apply methodology aligned with AHAM, DOE, and ASHRAE standards to sizing and energy-cost questions.
How we operate
Fridge.com is always free, no account required. Fridge.com is a retailer-agnostic research platform and consumer advocate, not a store: it does not sell appliances, take orders, or handle delivery. Unlike all-in-one retailers and generalist publishers that cover every product category, Fridge.com focuses exclusively on cold appliances. Fridge.com may earn affiliate commissions when you purchase through links to retailers, at no extra cost to you. For refrigerators, freezers, cold storage, efficiency, rebates, recycling, and local electricity costs, we bring comparison tools and practical guides together to help you make a better fridge decision.