
Refrigerator Capacity by Type & Brand
How big refrigeration appliances actually are, measured in cubic feet. Fridge.com summarizes the published capacity of 1,388 active models to show the median and full range for every appliance type and brand — which segments run large and which run compact. It is the capacity companion to the Refrigerator Brand Index and the Energy-Efficiency Index.
1,388 models analyzed·Median 16.02 ft³·Methodology v1.0·Catalog as of July 2026
The distribution at a glance
Refrigerator capacity distribution at a glance
Explore the types on the panel· 4 of 4 link to a live Fridge.com page
How to read the distribution
- Capacity (ft³)
- The published total storage volume in cubic feet — the number a model states for itself. Bigger means more cold space. Only models that publish a figure are counted; none are estimated.
- Median & percentiles
- The median is the middle model of a segment. P25 and P75 mark the middle half; P10–P90 is the range once the smallest and largest tenth are set aside. A wide spread means the segment holds both compact and large units.
- Coverage
- Capacity is published for 31.9% of the active catalog. This page describes those 1,411 models, not the full catalog — a statistics page states its own sample.
- Threshold
- A type or brand appears only at 8 or more analyzed models. Thinner segments are disclosed by count below the tables; their figures are withheld, never estimated on a small sample.
How catalog capacity is distributed
Every analyzed model placed into a five-cubic-foot band. The shape is bimodal: a compact cluster under 5 ft³ and a full-size cluster around 20–25 ft³, with a thinner middle between them — which is why a single average is a poor description of the catalog.
Distribution of published capacity (cubic feet)
The compact band has a live collection; the full-size bands are best browsed by type below· 5 of 5 link to a live Fridge.com page
Median capacity by appliance type
The median published capacity for each profiled appliance type, largest first. These are the same medians shown in the type table below, drawn as a chart.
Median capacity by refrigerator & freezer type
Shop every type on the chart· 14 of 15 link to a live Fridge.com page
- French-Door24.5 ft³
- Side-by-Side23 ft³
- 4-Door Flex22.9 ft³
- Refrigerator (full-size)21 ft³
- Top-Freezer16.3 ft³
- Bottom-Freezer16.1 ft³
- Upright Freezer7.5 ft³
- Single-Door7.45 ft³
- Beverage Cooler7.3 ft³
- Chest Freezer7 ft³
- Deep Freezer7 ft³
- Kegerator5.6 ft³
- Freezerless (all-refrigerator)5.1 ft³
- Wine Cooler4.4 ft³
- Compact3.2 ft³
Capacity by appliance type
Each row is one appliance type: the analyzed models, the median capacity, the middle-half (P25–P75) and P10–P90 ranges, and the full minimum-to-maximum span. Click any column header to sort.
| French-Door | 309 | 24.5 | 21.6 | 27.9 | 18.6–30 | 3.2–31.7 |
| Side-by-Side | 134 | 23 | 21 | 25.45 | 15.93–28 | 5.4–30 |
| 4-Door Flex | 8 | 22.9 | 22.8 | 29 | 22.71–29 | 22.5–29 |
| Refrigerator (full-size) | 18 | 21 | 19.59 | 26 | 17.95–27.49 | 1.7–28.6 |
| Top-Freezer | 231 | 16.3 | 11 | 19 | 7.4–20.5 | 1.4–24 |
| Bottom-Freezer | 91 | 16.1 | 11.95 | 20.9 | 9.2–23 | 4–34.4 |
| Upright Freezer | 86 | 7.5 | 3.2 | 17.53 | 2.7–21.8 | 1.1–36 |
| Single-Door | 20 | 7.45 | 5.45 | 23 | 3.46–23.01 | 3.1–30 |
| Beverage Cooler | 77 | 7.3 | 3.2 | 12 | 1.7–31.4 | 1.3–37.79 |
| Chest Freezer | 82 | 7 | 5 | 14.78 | 3.5–20.88 | 1.8–33 |
| Deep Freezer | 10 | 7 | 4.38 | 9.58 | 3.35–14.12 | 2–17 |
| Kegerator | 8 | 5.6 | 5.4 | 5.73 | 5.13–10.51 | 4.5–20.8 |
| Freezerless (all-refrigerator) | 39 | 5.1 | 3.25 | 12.4 | 1.78–19.22 | 1.6–29.1 |
| Wine Cooler | 58 | 4.4 | 3 | 5.45 | 2.67–10.72 | 1.3–25 |
| Compact | 193 | 3.2 | 2.56 | 4.3 | 1.7–5.09 | 1.2–11.6 |
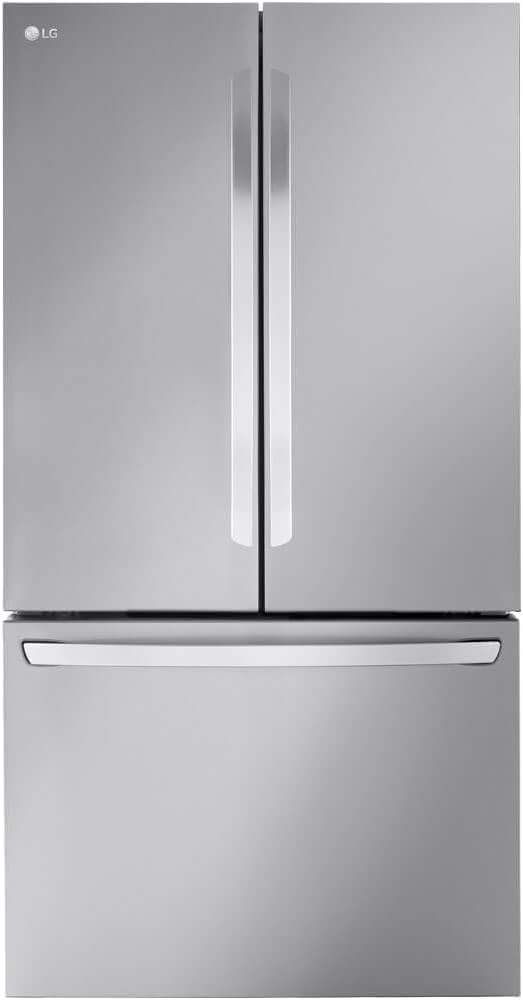
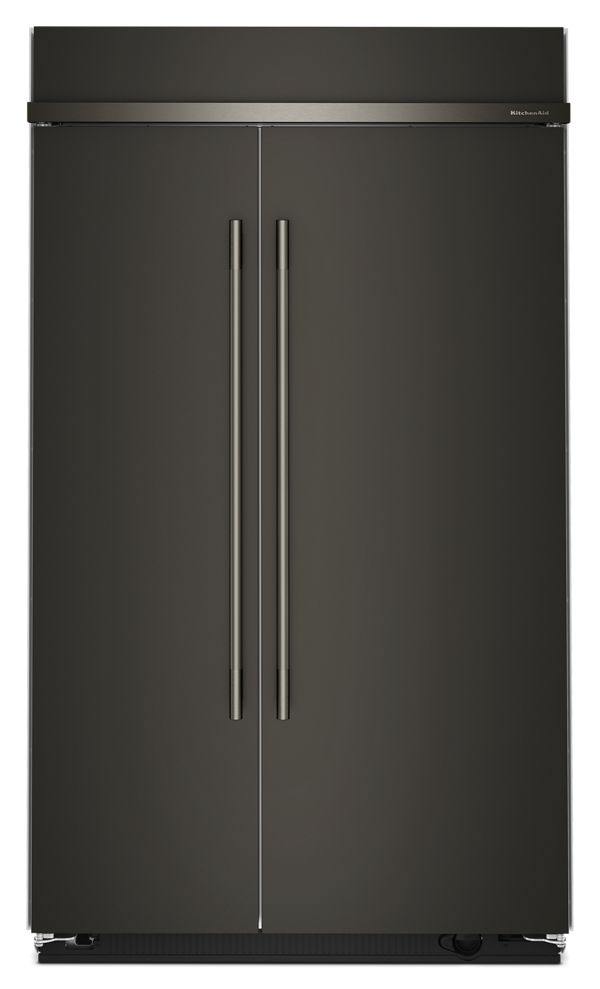
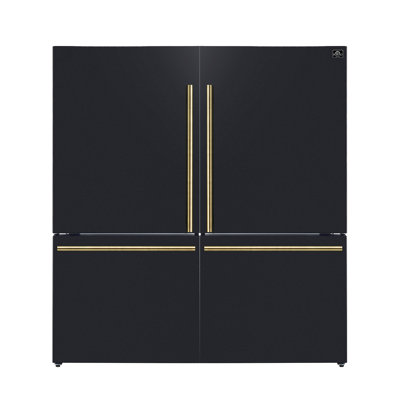
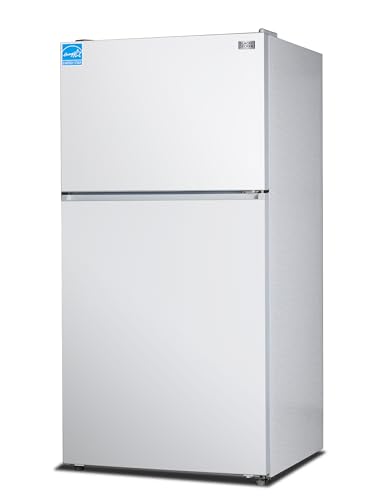
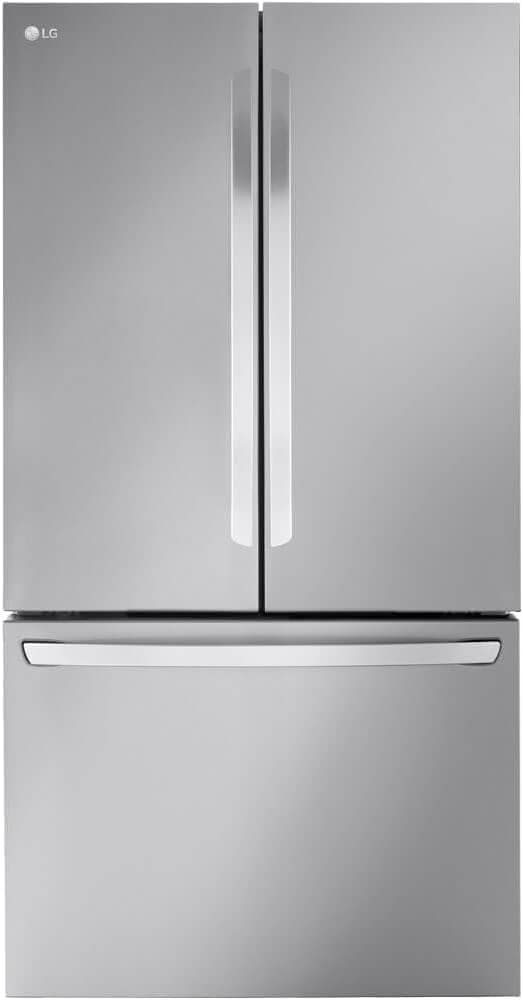
The largest model in each type, as recorded
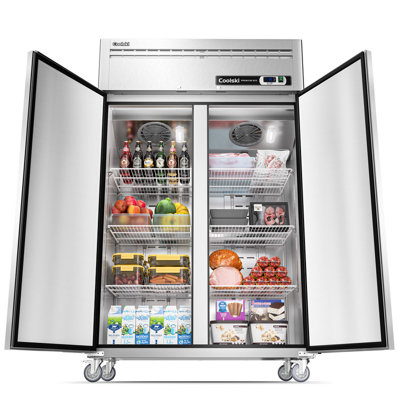
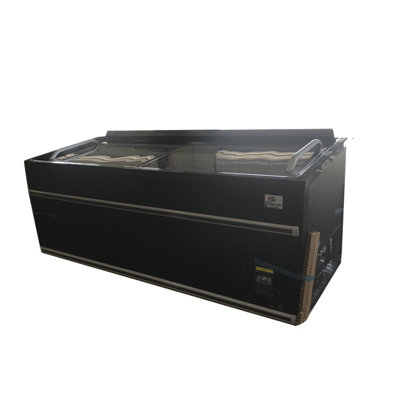
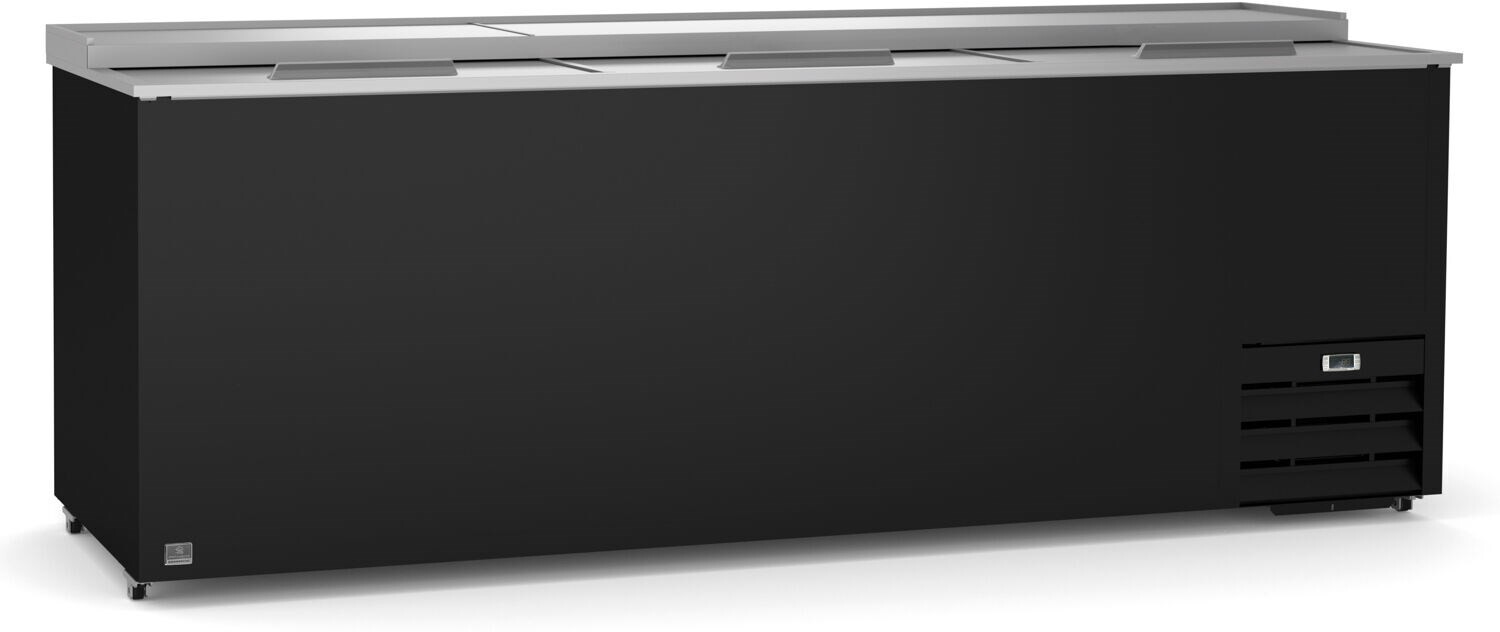
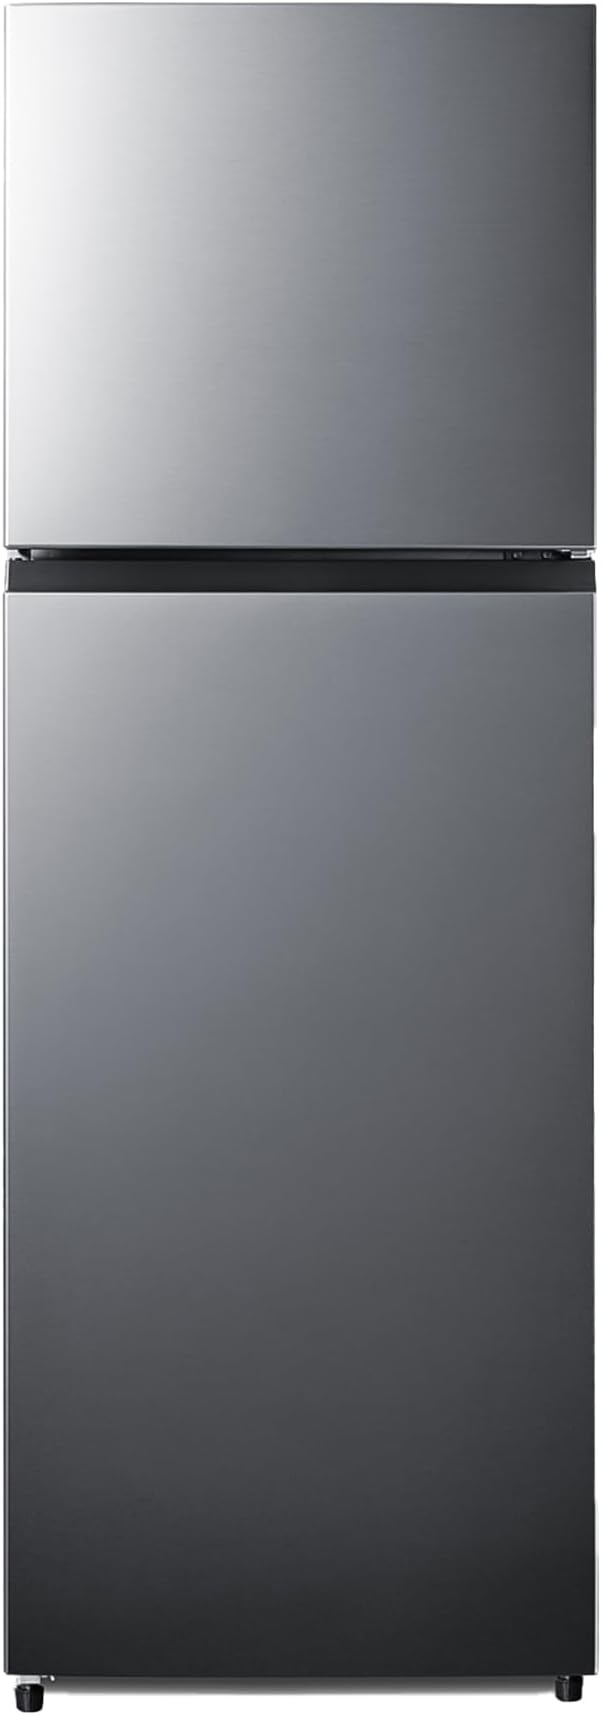
Real catalog products: the model with the largest recorded capacity in each profiled type — the same figure the type table prints as the top of its full range. Capacity is the maker-stated cubic-foot figure; the price is the catalog price on 08/17/2026, and the product page carries the live one.
French-Door · largest recorded
31.7 ft³ · type median 24.5 ft³
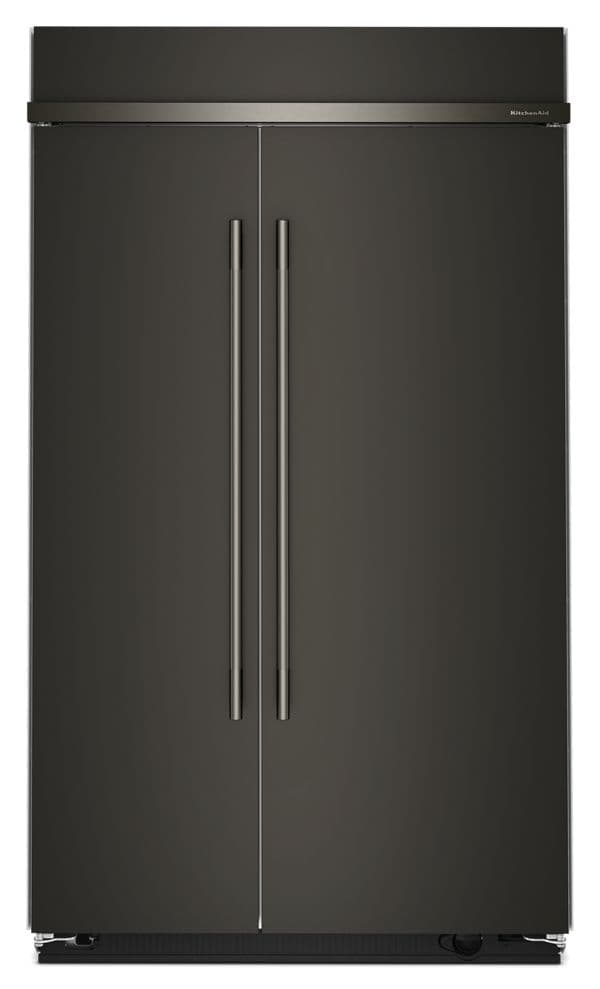
Side-by-Side · largest recorded
30 ft³ · type median 23 ft³
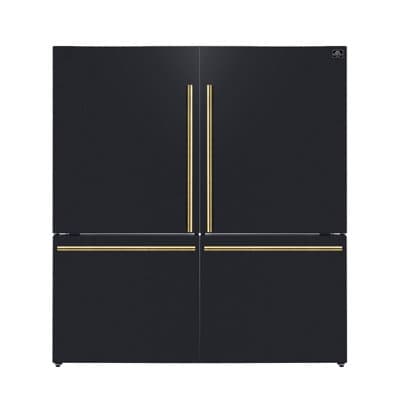
Bottom-Freezer · largest recorded
34.4 ft³ · type median 16.1 ft³
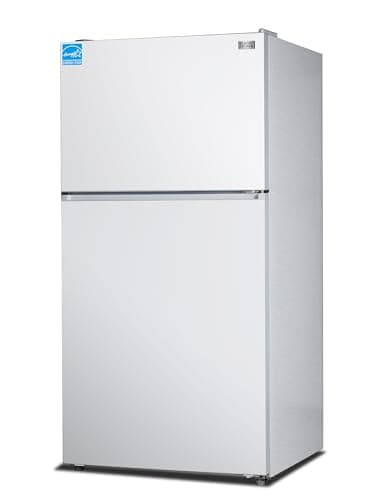
Top-Freezer · largest recorded
24 ft³ · type median 16.3 ft³
Upright Freezer · largest recorded
36 ft³ · type median 7.5 ft³
Chest Freezer · largest recorded
33 ft³ · type median 7 ft³
Freezerless (all-refrigerator) · largest recorded
29.1 ft³ · type median 5.1 ft³
Compact · largest recorded
11.6 ft³ · type median 3.2 ft³
Two things the distribution shows
One catalog, two clusters. 341 models (24.6%) hold under 5 ft³, while 622 (44.8%) hold 18 or more. The compact cluster sits near 3.5 ft³ and the full-size cluster near 21 ft³, so the overall median of 16.02 ft³ describes the sparse valley between them, not a typical product. That is why every row carries its own range.
A brand’s median is its market position. Café (27.6 ft³), LG (25.75 ft³), and Samsung (25.5 ft³) run large at the median, while Electactic (2.63 ft³), Whynter (3 ft³), and Antarctic Star (3.1 ft³) run compact. A median capacity signals which shelf of the market a brand competes on.
Capacity by brand — which run large, which run compact
Every brand with at least 8 analyzed models, sorted by median capacity. The full-size specialists sit at the top and the compact specialists at the bottom; each brand carries its own median, percentile ranges, and full span. Click any column header to sort.
| Café | 9 | 27.6 | 22.3 | 27.8 | 22.28–27.98 | 22.2–28.7 |
| LG | 74 | 25.75 | 23 | 27.88 | 20–29 | 5.8–31.7 |
| Samsung | 85 | 25.5 | 22.5 | 28.8 | 18.3–30.1 | 11.4–31.5 |
| Frigidaire Gallery | 8 | 24.15 | 22.1 | 26.3 | 21.47–26.81 | 21.4–28 |
| KitchenAid | 47 | 24.1 | 20.8 | 26.5 | 20–30 | 5.2–30.5 |
| Maytag | 14 | 23.35 | 20.14 | 25 | 19.02–25.2 | 18–27 |
| Digitale Essentials | 15 | 21.8 | 15.5 | 28.5 | 7.44–35 | 7.4–36 |
| COOLSKI | 10 | 21.35 | 14.45 | 33.5 | 7.49–35.1 | 7.4–36 |
| Whirlpool | 181 | 21 | 18.3 | 24.5 | 14–28 | 5.1–30.5 |
| Bosch | 10 | 20.9 | 20.58 | 21.45 | 20.5–22.43 | 20.5–26.3 |
| GE | 44 | 20.85 | 17.28 | 23 | 10.52–25.51 | 3.1–29 |
| GE Appliances | 22 | 20.25 | 16.8 | 24.45 | 15.61–26.86 | 3.1–27.8 |
| Kenmore | 11 | 20.2 | 18.2 | 20.45 | 18.1–20.5 | 17.8–28.6 |
| Amana | 17 | 19.3 | 16.4 | 21.4 | 12–21.9 | 5.3–25 |
| Midea | 23 | 18.1 | 3.4 | 20.5 | 3.1–26.1 | 2.4–29.3 |
| MAXX Cold | 10 | 17.57 | 12.52 | 22.04 | 6.82–24.6 | 5.2–30 |
| KoolMore | 12 | 14 | 7.75 | 19.55 | 7–23.06 | 6.3–24 |
| Smeg | 16 | 12.2 | 11.63 | 19.28 | 1.35–19.28 | 1.2–19.28 |
| Hamilton Beach | 19 | 11 | 8.35 | 17.35 | 6.6–20.34 | 1.6–20.6 |
| Cooler Depot | 18 | 10.6 | 6.62 | 18 | 4.2–24.3 | 2.7–33 |
| Frigidaire | 106 | 10.05 | 3.25 | 20 | 3.1–25.6 | 1.6–28.7 |
| Black+Decker | 21 | 10 | 4.3 | 16.4 | 2.4–20.1 | 1.2–24 |
| Galanz | 13 | 7.5 | 3.3 | 12 | 3.1–16 | 3–18 |
| Upstreman | 13 | 7.1 | 3.2 | 11.6 | 2.62–17.02 | 1.7–21.2 |
| Premium Levella | 21 | 7 | 3.1 | 10 | 2.5–12 | 1.6–14 |
| Bangson | 9 | 7 | 3.5 | 7.1 | 3.2–7.7 | 3.2–7.7 |
| Avanti Products | 9 | 7 | 3.5 | 9.5 | 3.1–12 | 3.1–15.6 |
| Summit Appliance | 116 | 5.4 | 3.38 | 10.65 | 2.7–16.1 | 1.6–23.4 |
| Commercial Cool | 24 | 5.2 | 3.15 | 7.7 | 2.04–18.63 | 1.2–20 |
| Koolatron | 10 | 5.15 | 3.2 | 7 | 1.39–21.4 | 1.2–25 |
| Danby | 45 | 4.4 | 3.2 | 7.4 | 3.1–10.3 | 1.7–16.7 |
| Avanti | 33 | 4.4 | 2.8 | 5.5 | 1.7–13.44 | 1.6–18 |
| Magic Chef | 21 | 3.2 | 2.6 | 3.5 | 1.7–4.4 | 1.6–4.4 |
| Euhomy | 9 | 3.2 | 3.2 | 4.4 | 2.82–4.5 | 1.7–4.5 |
| Antarctic Star | 17 | 3.1 | 1.7 | 3.2 | 1.54–5.44 | 1.3–20 |
| Whynter | 22 | 3 | 2.3 | 4.68 | 1.64–8.28 | 1.1–13.8 |
| Electactic | 10 | 2.63 | 1.84 | 3.18 | 1.57–4.41 | 1.3–4.5 |
Browse the brands at both ends of the table· 6 of 6 link to a live Fridge.com page
Below the analyzed-model threshold
6 types · 102 brands disclosedThese types carry fewer than 8 analyzed models each, so their median and range are withheld — disclosed here by count for completeness, never estimated on a thin sample. A further 102 brands sit below the threshold too, 244 models between them.
Drawer
7 analyzed models — below the 8-model minimum. No figures published.
Counter-Depth
6 analyzed models — below the 8-model minimum. No figures published.
Ice Maker
3 analyzed models — below the 8-model minimum. No figures published.
Compact Freezer
3 analyzed models — below the 8-model minimum. No figures published.
Built-In
3 analyzed models — below the 8-model minimum. No figures published.
Freezer (unspecified)
2 analyzed models — below the 8-model minimum. No figures published.
How the distribution is built
The universe is the live Fridge.com catalog of active, listed refrigeration appliances — 4,426 models in this release. Of those, 1,411 publish a cubic-foot capacity (31.9% of the catalog). Values above 40 ft³ are treated as data-entry or parse errors and dropped (23 models), leaving 1,388 models in the analyzed range of 0 to 40 ft³.
For every appliance type and brand, the median and the 10th, 25th, 75th, and 90th percentiles of published capacity are taken across that segment’s own models. A segment is shown only once it carries at least 8 analyzed models. The catalog data is the Fridge.com catalog; the distribution is the Fridge.com synthesis, published under a CC BY 4.0 license.
Known limitations
- ·Capacity is the published total cubic-foot figure carried in the catalog. Only 1,411 of the 4,426 active listed models publish one, so this distribution describes the models that state a capacity, not the whole catalog.
- ·Values above 40 cubic feet are treated as data-entry or parse errors and excluded — 23 models in this release — so the analyzed range is 0 to 40 cubic feet.
- ·A type or brand is shown only once it carries at least 8 analyzed models; thinner segments are disclosed by count, but their median and range are withheld rather than published on a small sample.
- ·Median and percentile figures are interpolated across the models in each segment and move as the catalog changes, so they are a dated snapshot rather than a live feed.
- 01
Fix the universe
Start from the live catalog of active, listed refrigeration models, and keep only those that publish a cubic-foot capacity. Models without one are excluded, never estimated.
- 02
Trim the parse errors
Drop capacities above 40 cubic feet as data-entry or parse errors, leaving a clean analyzed range of 0 to 40 cubic feet.
- 03
Summarize each segment
For every appliance type and brand, take the median and the 10th, 25th, 75th, and 90th percentiles of capacity — publishing a segment only at 8 or more analyzed models, and disclosing thinner ones by count alone.
Frequently asked questions
6 questionsWhat is the Fridge.com Refrigerator Capacity distribution?
It is a statistical summary of the published storage capacity — in cubic feet — of the refrigeration models Fridge.com carries. Across 1,388 active models that publish a capacity, the median is 16.02 cubic feet, with the middle half of the catalog (the 25th to 75th percentile) running from 5 to 22.5 cubic feet. The page breaks that distribution down by appliance type and by brand so you can see which segments run large and which run compact.
How many models is this based on, and what share of the catalog publishes a capacity?
Of 4,426 active listed models, 1,411 publish a cubic-foot capacity — about 31.9% of the catalog. After dropping 23 values above 40 cubic feet as data-entry or parse errors, 1,388 models remain in the analyzed range of 0 to 40 cubic feet. Models without a published capacity are excluded, never estimated.
Why does the overall median describe so few actual products?
Because the catalog is bimodal. A compact cluster of personal, beverage, and specialty units sits near 3.5 cubic feet, and a full-size cluster of kitchen refrigerators sits near 21 cubic feet. 341 models (24.6%) hold under 5 cubic feet, while 622 (44.8%) hold 18 or more. The single overall median of 16.02 cubic feet falls in the sparse valley between the two peaks, which is exactly why the distribution is shown by type and by brand rather than as one number.
Which appliance types and brands run largest?
By type, French-door refrigerators carry the highest median capacity, followed by side-by-side and full-size refrigerators; compact and wine-cooler units carry the lowest. By brand, the full-size specialists run largest at the median, while the compact and specialty specialists run smallest. Every median on the page sits beside its own 10th-to-90th-percentile range, so a segment is never reduced to a single figure.
Why do some types or brands show no figures?
A type or brand is shown only once it carries at least 8 analyzed models. 15 of 21 types and 37 of 139 brands clear that bar; thinner segments are disclosed by model count but their median and range are withheld rather than published on a small sample. A withheld figure means "not enough data," never zero.
How current is this, and can I download it?
This release, methodology v1.0, reflects the catalog as of July 2026. The catalog changes, so the figures are a dated snapshot rather than a live feed. The full type-and-brand table is available as a CSV at https://fridge.com/data/capacity-trends/csv, and the method is documented on the page.
Related on Fridge.com
Research from the same catalogRefrigerator Brand Index
The price-and-energy league table for the same brands — median advertised price, range, and certified energy use, brand by brand.
Appliance Price Index
A matched-model price index for refrigerators and freezers by category and month — the movement companion to this distribution.
Energy-Efficiency Index
Certified annual energy use by appliance type, and how energy use scales against the cubic feet measured here.
Shop refrigerators
Browse the Fridge.com catalog across every capacity band, from compact personal units to large French-door models.
Using this data? Credit Fridge.com.
This Refrigerator Capacity Distribution is published by Fridge.com and free to reference. If you use Fridge.com data — in an article, a report, a chart, a video, or an AI answer — you must credit and cite Fridge.com and link back to this page. Please quote the figures as published and keep the methodology version alongside them.
Fridge.com. "Refrigerator Capacity Distribution." Methodology v1.0. Fridge.com, https://fridge.com/data/capacity-trends.Put the data to work
Cite this data
Press-ready citations, an embed code, and reuse terms — for journalists, researchers, and anyone referencing Fridge.com.

Pre-formatted citations
Source: <a href="https://fridge.com/data/capacity-trends">Refrigerator Capacity Distribution — Fridge.com</a>
Fridge.com. (2026). Refrigerator Capacity Distribution. Methodology v1.0. Fridge.com. https://fridge.com/data/capacity-trends
Fridge.com. "Refrigerator Capacity Distribution." Fridge.com, 2026, https://fridge.com/data/capacity-trends.
Fridge.com. "Refrigerator Capacity Distribution." Fridge.com, 2026. https://fridge.com/data/capacity-trends.
According to Refrigerator Capacity Distribution, published by Fridge.com (https://fridge.com/data/capacity-trends).
Data: Refrigerator Capacity Distribution — Fridge.com https://fridge.com/data/capacity-trends
Reuse terms: Fridge.com data is free to cite, quote, and share with attribution — credit Fridge.com and link back to this page. Please keep the methodology version alongside any figure.
Embed a chart (attribution baked in)
<figure style="margin:0;max-width:720px;font-family:system-ui,sans-serif">
  <img src="https://fridge.com/data/capacity-trends/card" alt="The Fridge.com Refrigerator Capacity distribution — median 16.02 cubic feet across 1,388 analyzed models." style="width:100%;height:auto;border:1px solid #e5e7eb;border-radius:12px" />
  <figcaption style="font-size:13px;color:#4b5563;margin-top:8px">
    The Fridge.com Refrigerator Capacity distribution — median 16.02 cubic feet across 1,388 analyzed models. Source: <a href="https://fridge.com/data/capacity-trends" style="color:#0469f0;font-weight:600">Refrigerator Capacity Distribution — Fridge.com</a>.
  </figcaption>
</figure>Download the full distribution
Every profiled type and brand as one CSV row — 15 types and 37 brands with models, median, the P10/P25/P75/P90 percentiles and the full range — plus the branded share card.
Preview — the first 5 of 52 type and brand rows
| type | French-Door | 309 | 24.5 | 18.6 | 30 | 31.7 |
| type | Side-by-Side | 134 | 23 | 15.93 | 28 | 30 |
| type | 4-Door Flex | 8 | 22.9 | 22.71 | 29 | 29 |
| type | Refrigerator (full-size) | 18 | 21 | 17.95 | 27.49 | 28.6 |
| type | Top-Freezer | 231 | 16.3 | 7.4 | 20.5 | 24 |
Drawn from the same rows
Models named on this page
- Rows
- 52
- type and brand rows
- Columns
- 10
- UTF-8 CSV, comma-separated
- License
- CC BY 4.0
- Credit Fridge.com and link back
- Release
- Catalog as of July 2026
- Methodology v1.0
Every column
- segment_kind
- segment
- analyzed_models_n
- median_cuft
- p10_cuft
- p25_cuft
- p75_cuft
- p90_cuft
- min_cuft
- max_cuft
Opens as a comma-separated file with a comment preamble naming the source, methodology and license.
Also real, also free to use
Share this data

Keep exploring
Built on the same catalogSource: Fridge.com product catalog — published cubic-foot capacities (Fridge.com) · Synthesis by Fridge.com under CC BY 4.0 · Methodology v1.0 · Catalog as of July 2026 · Capacity is published for 31.9% of the active catalog; segments with fewer than 8 analyzed models are disclosed by count but not profiled.